Check out this visualization if you are impatient! Read further if you want to know what the visualization shows.
This is a short report of some of the research Anita Wagner and I perform at the ear-nose and throat department of the university medical center Groningen. The aim is to show to the participant what we do with the data they kindly provide to us when they volounteer in one of the experiments.
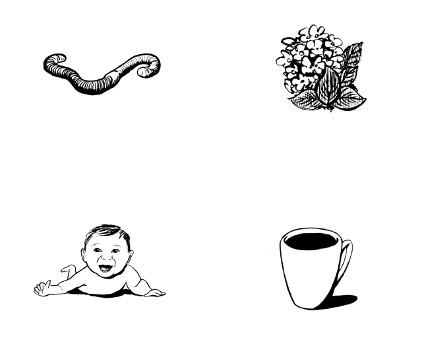
Screen display of one experimental trial:
In this task participants have to click on the drawing which represents the subject of the sentence that they hear. The upper left drawing represents a worm (NL: worm), the upper right one an hydrangea (NL: hortensia), on the lower left is a baby (NL: baby) and on the lower right a cup (NL: beker). While the four figures were displayed on a computer screen participants heard the Dutch sentence: 'vandaag is de baby een stuk verder gekropen' (EN: today the baby crawled a lot further). In this case 'baby' is the target drawing whereas 'beker' is a competitor because in Dutch the first syllable of beker sounds the same as the first sillable of baby. Eye movements and pupil sizes were measured while the participant was hearing the sentence and searching for the target figure.
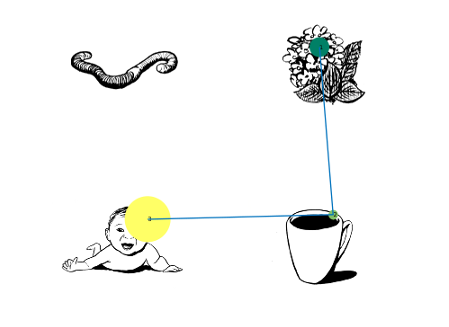
Participant's fixations during one experimental trial:
One participant's fixations superimposed to the screenshot of the experimental trial described above. The size of the circle reflects the amount of time spent on the given point. The numbers in the circle represent the order in the fixation. This particular participant was looking at the hydrangea (green dot), briefly changed to the cup (beker, the competitor - green-yellow dot) when hearing 'be' of ba-by and then moved to the baby (the target drawing - yellow dot) when s/he recognized the drawing of the baby was his/her target. The movie below displays the same trial with eye-movements and pupil size changes measured in another participant. Drawings are organized differently, but the sentence is the same.
Video recording of one participants eye-movement and pupil size:
In this movie the word becomes red when it is pronounced by the speaker. The target word becomes blue when it is pronounced. The moving dot represents the fixation point, where the participant is looking. Also the moving dot changes from red to blue when the target word is pronounced. The size of the dot instead reflects the size of the participant's pupil. Changes in pupil size reflect changes in cognitive effort: the bigger the circle the higher the cognitive effort.
Select a dataset to display some of the participants' eye recordings:
The figure represents the time course of the proportion of fixation to the target, competitor, and two distractors figures. The datasets represents one normal hearing participant (nh) and two participants with a cochlear implant (c and ci). dataCIs is an average of both CI participants. Time 0 represents when word baby is pronuonced. When the lines stop crossing each other it means that the words are disambuguated. For these plots I used only sentences when the target words was correctly identified. This scientific publication contains more detailed information about the methods, analysis and findings described above. Browsing through the data is clear that the identification of the target word was particularly difficult for ci_s. Back to Home
 In this task participants have to click on the drawing which represents the subject of the sentence that they hear. The upper left drawing represents a worm (NL: worm), the upper right one an hydrangea (NL: hortensia), on the lower left is a baby (NL: baby) and on the lower right a cup (NL: beker). While the four figures were displayed on a computer screen participants heard the Dutch sentence: 'vandaag is de baby een stuk verder gekropen' (EN: today the baby crawled a lot further). In this case 'baby' is the target drawing whereas 'beker' is a competitor because in Dutch the first syllable of beker sounds the same as the first sillable of baby. Eye movements and pupil sizes were measured while the participant was hearing the sentence and searching for the target figure.
 One participant's